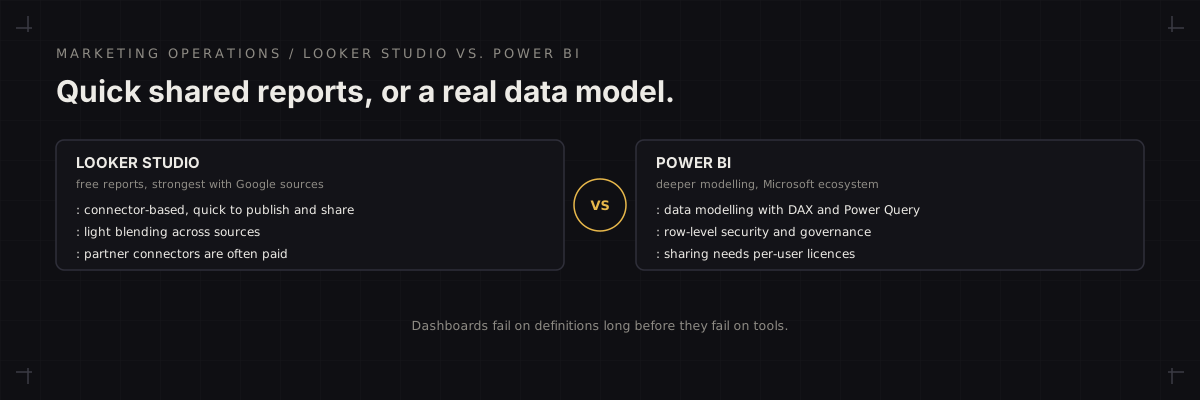
Short answer: Looker Studio is the practical default when your data sits mostly in Google products and marketing platforms with ready-made connectors, and you want shareable dashboards without licences. Power BI is worth the step up when you need deeper data modelling, joins across many sources, row-level security, or you already run on Microsoft 365.
Marketing teams rarely choose a reporting tool in isolation. The decision usually follows where the data already lives and how many people need to see the numbers, so start there rather than with a feature list.
Where Looker Studio wins
- Cost and speed to a first dashboard. It is free to use with a Google account, and a report built on connected sources can be shared by link the same day.
- Google-native sources. GA4, Search Console, Google Ads and Sheets connect with little setup.
- A low barrier for the team. Marketers can build and edit reports without learning a modelling language.
Where Power BI wins
- A real modelling layer. Power Query and DAX let you clean, join and calculate across many sources, which is where complex marketing and revenue reporting ends up.
- Governance. Row-level security, certified datasets and controlled sharing suit larger organizations and agencies reporting to many clients.
- Microsoft fit. Teams already on Microsoft 365 and Azure often find access, authentication and distribution simpler.
Decision table
| Situation | Leans toward |
|---|---|
| Mostly Google data, small team, quick sharing | Looker Studio |
| Many sources that must join into one model | Power BI |
| Client-by-client access control needed | Power BI |
| Tight budget, simple weekly reporting | Looker Studio |
| Numbers must reconcile with finance and CRM | Power BI on a modelled dataset |
The real problem is usually upstream
Neither tool fixes inconsistent definitions. If one report counts a lead when a form is submitted and another when sales accepts it, a better tool simply displays the disagreement more clearly. Agree the metric definitions first, using the guide to what a marketing dashboard should include, and read the audit on dashboards a growth team cannot trust for the usual failure points. When tracking or data connections are the weak link, the marketing infrastructure service covers that foundation before any dashboard is built.
FAQ
Can Looker Studio pull data from ad platforms like Meta and LinkedIn?
Not natively for every platform. It relies on connectors, some from Google and many from third parties that are often paid. Check that each of your sources has a maintained connector, and expect more limited joins across sources than you would get from a modelled warehouse.
- Third-party connectors cover most ad platforms, often at a cost.
- Cross-source joins are more limited than in a modelled warehouse.
When should marketing move to a warehouse and a BI tool?
When reports need joins across ad spend, CRM and revenue, when numbers have to reconcile across teams, or when dashboards slow down or break. Until then, a small set of connected reports is usually cheaper and fast enough.
- Joins across spend, CRM and revenue are the usual trigger.
- Before that, simple connected reports are usually enough.